OK.Wahl
Internetpräsentation
Version 2.2.7
Vorläufiges Ergebnis zur Landtagswahl 2013 am 15.09.2013
Stimmkreis Wunsiedel, Kulmbach - Landkreis Kulmbach - Gemeinde Himmelkron
Es wurden alle Stimmbezirke ausgewertet.
 Diagramm
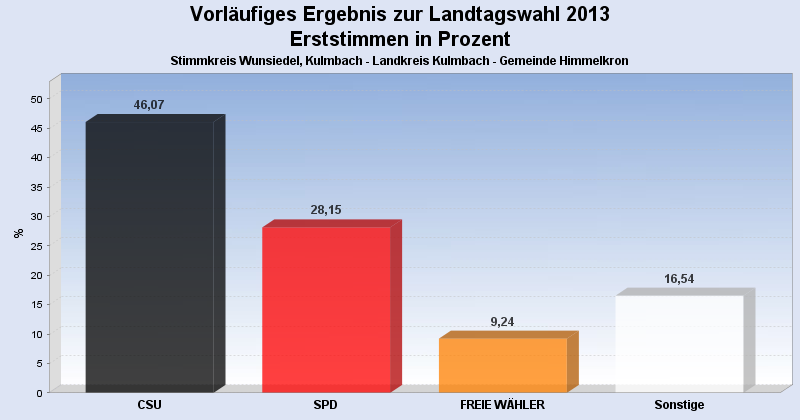
 Seitenanfang
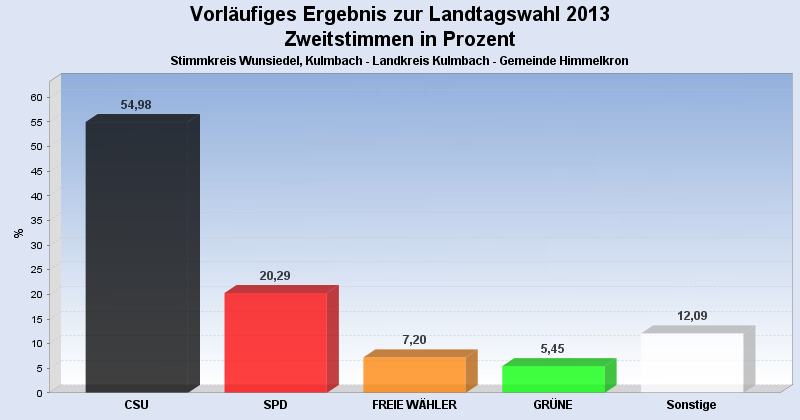
Wahlbeteiligung, Stimmzettel, Stimmen
| Wahlbeteiligung: | 57,25% |
|---|---|
| Stimmberechtigte: | 2.812 |
| Wähler: | 1.610 |
| Ungültige Erststimmen: | 8 |
| Gültige Erststimmen: | 1.602 |
| Ungültige Zweitstimmen: | 13 |
| Gültige Zweitstimmen: | 1.597 |
Erststimmen nach Wahlvorschlag
| Partei | Erststimmen | Prozent | |
|---|---|---|---|
| 1 | Schöffel, Martin ( CSU ) | 738 | 46,07% |
| 2 | Aures, Inge ( SPD ) | 451 | 28,15% |
| 3 | Baumgärtner, Martin ( FREIE WÄHLER ) | 148 | 9,24% |
| 12 | Ludwig, Georg Dieter ( DIE FRANKEN ) | 63 | 3,93% |
| 4 | Artmann, Brigitte ( GRÜNE ) | 55 | 3,43% |
| 6 | Meist, Christa ( DIE LINKE ) | 44 | 2,75% |
| 5 | Nagel, Thomas ( FDP ) | 37 | 2,31% |
| 13 | Hanakam, Bernhard ( PIRATEN ) | 26 | 1,62% |
| 7 | Bittermann, Ehrenfried ( ÖDP ) | 14 | 0,87% |
| 8 | Krause, Rainer ( REP ) | 11 | 0,69% |
| 10 | Roppelt, Markus ( BP ) | 8 | 0,50% |
| 9 | Bestehorn, Harald ( NPD ) | 7 | 0,44% |
Zweitstimmen nach Wahlvorschlag
| Partei | Zweitstimmen | Prozent | |
|---|---|---|---|
| 1 | CSU | 878 | 54,98% |
| 2 | SPD | 324 | 20,29% |
| 3 | FREIE WÄHLER | 115 | 7,20% |
| 4 | GRÜNE | 87 | 5,45% |
| 5 | FDP | 42 | 2,63% |
| 6 | DIE LINKE | 40 | 2,50% |
| 12 | DIE FRANKEN | 38 | 2,38% |
| 13 | PIRATEN | 24 | 1,50% |
| 7 | ÖDP | 13 | 0,81% |
| 8 | REP | 13 | 0,81% |
| 10 | BP | 8 | 0,50% |
| 11 | FRAUENLISTE | 8 | 0,50% |
| 9 | NPD | 7 | 0,44% |
- Stand: 16.09.2013 09:35:25