OK.Wahl
Internetpräsentation
Version 2.2.7
Vorläufiges Ergebnis zur Landtagswahl 2013 am 15.09.2013
Stimmkreis Wunsiedel, Kulmbach - Landkreis Kulmbach - Markt Wonsees
Es wurden alle Stimmbezirke ausgewertet.
 Diagramm
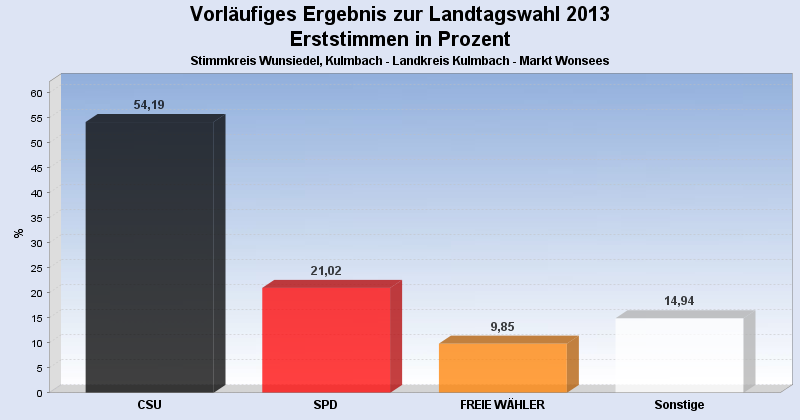
 Seitenanfang
Wahlbeteiligung, Stimmzettel, Stimmen
| Wahlbeteiligung: | 67,69% |
|---|---|
| Stimmberechtigte: | 913 |
| Wähler: | 618 |
| Ungültige Erststimmen: | 9 |
| Gültige Erststimmen: | 609 |
| Ungültige Zweitstimmen: | 8 |
| Gültige Zweitstimmen: | 610 |
Erststimmen nach Wahlvorschlag
| Partei | Erststimmen | Prozent | |
|---|---|---|---|
| 1 | Schöffel, Martin ( CSU ) | 330 | 54,19% |
| 2 | Aures, Inge ( SPD ) | 128 | 21,02% |
| 3 | Baumgärtner, Martin ( FREIE WÄHLER ) | 60 | 9,85% |
| 5 | Nagel, Thomas ( FDP ) | 23 | 3,78% |
| 4 | Artmann, Brigitte ( GRÜNE ) | 22 | 3,61% |
| 12 | Ludwig, Georg Dieter ( DIE FRANKEN ) | 15 | 2,46% |
| 8 | Krause, Rainer ( REP ) | 8 | 1,31% |
| 6 | Meist, Christa ( DIE LINKE ) | 6 | 0,99% |
| 7 | Bittermann, Ehrenfried ( ÖDP ) | 6 | 0,99% |
| 13 | Hanakam, Bernhard ( PIRATEN ) | 4 | 0,66% |
| 10 | Roppelt, Markus ( BP ) | 4 | 0,66% |
| 9 | Bestehorn, Harald ( NPD ) | 3 | 0,49% |
Zweitstimmen nach Wahlvorschlag
| Partei | Zweitstimmen | Prozent | |
|---|---|---|---|
| 1 | CSU | 411 | 67,38% |
| 2 | SPD | 68 | 11,15% |
| 3 | FREIE WÄHLER | 44 | 7,21% |
| 4 | GRÜNE | 24 | 3,93% |
| 5 | FDP | 13 | 2,13% |
| 12 | DIE FRANKEN | 12 | 1,97% |
| 6 | DIE LINKE | 8 | 1,31% |
| 13 | PIRATEN | 8 | 1,31% |
| 7 | ÖDP | 6 | 0,98% |
| 10 | BP | 6 | 0,98% |
| 8 | REP | 5 | 0,82% |
| 11 | FRAUENLISTE | 3 | 0,49% |
| 9 | NPD | 2 | 0,33% |
- Stand: 16.09.2013 09:37:29