OK.Wahl
Internetpräsentation
Version 2.2.7
Vorläufiges Ergebnis zur Landtagswahl 2013 am 15.09.2013
Stimmkreis Wunsiedel, Kulmbach - Landkreis Kulmbach - Gemeinde Guttenberg
Es wurden alle Stimmbezirke ausgewertet.
 Diagramm
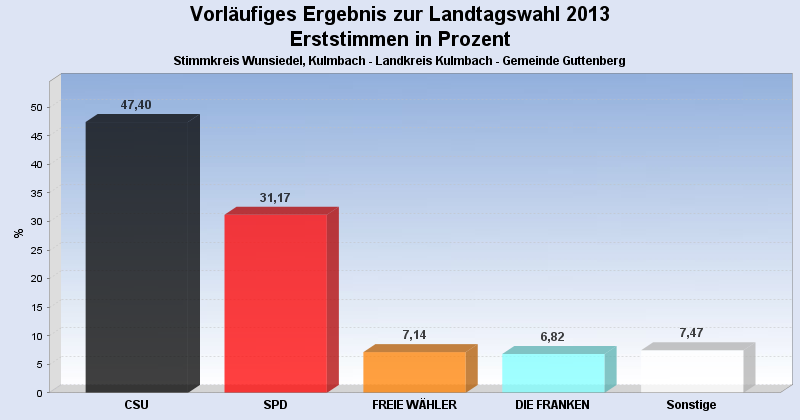
 Seitenanfang
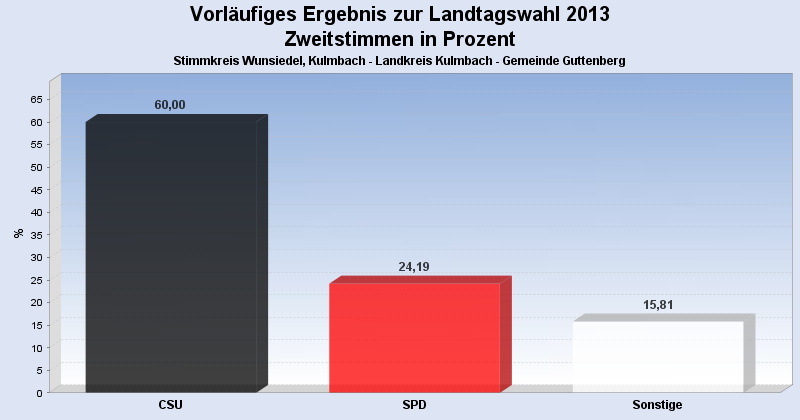
Wahlbeteiligung, Stimmzettel, Stimmen
| Wahlbeteiligung: | 69,33% |
|---|---|
| Stimmberechtigte: | 450 |
| Wähler: | 312 |
| Ungültige Erststimmen: | 4 |
| Gültige Erststimmen: | 308 |
| Ungültige Zweitstimmen: | 2 |
| Gültige Zweitstimmen: | 310 |
Erststimmen nach Wahlvorschlag
| Partei | Erststimmen | Prozent | |
|---|---|---|---|
| 1 | Schöffel, Martin ( CSU ) | 146 | 47,40% |
| 2 | Aures, Inge ( SPD ) | 96 | 31,17% |
| 3 | Baumgärtner, Martin ( FREIE WÄHLER ) | 22 | 7,14% |
| 12 | Ludwig, Georg Dieter ( DIE FRANKEN ) | 21 | 6,82% |
| 13 | Hanakam, Bernhard ( PIRATEN ) | 6 | 1,95% |
| 9 | Bestehorn, Harald ( NPD ) | 5 | 1,62% |
| 6 | Meist, Christa ( DIE LINKE ) | 4 | 1,30% |
| 5 | Nagel, Thomas ( FDP ) | 4 | 1,30% |
| 8 | Krause, Rainer ( REP ) | 2 | 0,65% |
| 4 | Artmann, Brigitte ( GRÜNE ) | 2 | 0,65% |
| 7 | Bittermann, Ehrenfried ( ÖDP ) | 0 | 0,00% |
| 10 | Roppelt, Markus ( BP ) | 0 | 0,00% |
Zweitstimmen nach Wahlvorschlag
| Partei | Zweitstimmen | Prozent | |
|---|---|---|---|
| 1 | CSU | 186 | 60,00% |
| 2 | SPD | 75 | 24,19% |
| 12 | DIE FRANKEN | 12 | 3,87% |
| 3 | FREIE WÄHLER | 9 | 2,90% |
| 9 | NPD | 8 | 2,58% |
| 13 | PIRATEN | 5 | 1,61% |
| 8 | REP | 4 | 1,29% |
| 6 | DIE LINKE | 3 | 0,97% |
| 4 | GRÜNE | 3 | 0,97% |
| 11 | FRAUENLISTE | 3 | 0,97% |
| 5 | FDP | 1 | 0,32% |
| 7 | ÖDP | 1 | 0,32% |
| 10 | BP | 0 | 0,00% |
- Stand: 16.09.2013 09:35:19